In the Game of Valuations, you win or you deleverage
The Pioneer Perspective - Monthly Macro for January, 2026
What We’ll Cover
· Liquidity Tightening
· The Market’s Reaction
· Bonds Telling a Different Story
· Historical Precedence and Where We Stand
This Isn’t Panic Selling, it’s Math
Over the last week the markets have started seeing significant selloffs in risk-assets. Big tech and crypto are down bad and X is flooded with people wondering what is going on. We want you to know that the reason for this selloff is tightening liquidity. For all our Game of Thrones fans out there, this is what happens when the Iron Bank decides it wants its money back, they start pulling from the armies that show the most risk of losing the war. Borrowing and leverage are not simply based off nominal rates (Fed’s rates) but rather real rates. Real rates are the nominal rate minus inflation expectations. For example, if the Federal Reserve has rates set at 5.25%, and inflation expectations drop from 4% to 2.5%, you’ve now increased the real rate from 1.25% to 2.75%. This is the market’s way of confirming that inflation IS posed for continued cooling. Lower inflation doesn’t automatically mean easier money. When rates stay high and the dollar is strong, borrowing becomes more expensive in real terms, and liquidity quietly tightens.
Another factor is a strong US Dollar. Why? Because the majority of foreign debt is denominated in the USD. This means that when foreign investors take on risk assets and borrow/leverage their positions, they are actually taking a larger risk because the value of their local fiat currency is an even lesser percentage of the USD. Furthermore, the USD strengthening is a sign of liquidity already being tight. When investors de-risk, deleverage, and head for the sidelines, that money is kept in cash (USD). This is why during most major market volatility and stress we see the USD gain strength. The dollar is strong not because growth is accelerating, but because liquidity is tight. High real rates, global dollar debt, and risk aversion are pulling capital into dollars even as inflation cools. Historically, the dollar tends to peak before the Fed actually cuts — not when markets begin to expect it. A stronger USD is a symptom of the economy not the source, it’s the smoke rather than the fire. All of these factors have led to margin collections and deleveraging across markets. Specifically, in the areas that typically give the greatest market returns.
The Market’s Reaction
We’ve spoken at length in our previous letters about overvaluation and euphoric returns. The last week of January showed that some of those chickens are coming home to roost. Price-to-earnings ratios are a great way to find price discovery and deduce if a company is overvalued or not. Over the last few years many companies in the S&P 500 have been trading significantly higher than average forward-looking P/E ratios. For example, TSLA 0.00%↑ is around 300x, LLY -0.67%↓ is 51x, NVDA -0.06%↓ is 47x, and PLTR 0.43%↑ just recently peaked at, wait for it… 400x! Forward P/E is where investors guess the company will be in 12 months, which justifies the inflated price. However, during stock market bubbles these hopes and dreams get way out of wack. The average historical forward P/E for an S&P 500 company is 22x.
Now you understand why big tech and crypto take such heavy hits during liquidity tightening. Tech growth stocks and crypto are almost entirely based off forward-looking estimates. “I’ll pay higher than the company is worth now because it will be even higher in a year” is the basic idea. The higher the P/E the more “hope” people have that the price is justified. Obviously, that doesn’t always workout in the investor’s favor. Remember this scene?

Davos lobbies on behalf of Stannis to the Iron Bank with hopes of securing an investment. The bank responds: “We look at numbers, we prefer the stories they tell.” Ultimately, Davos convinces them to invest, going against their original decision, and Stannis’ entire army is decimated shortly after. In today’s market, our version of the Iron Bank is telling us they prefer the story numbers tell them, which is not matched with the price of the most famous tickers. Crypto takes the hardest hit because many still believe it’s not backed by anything, just faux-currency up in the clouds with no tangible assets or government backing to justify a digital code being worth $80,000.
Bonds: The Coiling Continues
While over-leveraged crypto investors are having one of the worst weeks of their lives the bond market is singing a different tune. Bond yields across the board have been mostly flat for the better part of two years. Bond ETFs such as TLT -0.02%↓ and IEF -0.02%↓ are showing a similar pattern. TLT -0.02%↓ closed the month essentially flat, down only 0.03%, that is very telling given the current environment. Here are the basics of what growth stocks react to versus the bond market.
Equities and crypto react to:
· Earnings
· Narratives
· Momentum
· Liquidity today
Bonds react to:
· Growth expectations
· Inflation expectations
· Future policy paths
· Recession risk
The fact that bonds stayed mostly flat on the month while growth experienced huge red candles tells us a few things. Bond markets are confirming that inflation is expected to keep cooling, growth is slowing, and an easing rate cycle is coming. During periods of high growth and high inflation bond yields surge, during recessions they tank, and between these cycles they stay flat, awaiting a potential storm. Bonds are telling us that we are late-cycle, but they are not screaming recession YET. If inflation was expected to come back, or rates were expected to stay high, then bonds would be falling like a rock rather than staying flat. TLT didn’t rally because the easing cycle hasn’t started yet, but it didn’t fall because the bond market doesn’t believe higher yields are the next chapter.
In our newsletter last week we said this:
This coil can only go on for so long. Eventually, history tells us that it will SNAP in one direction or the other. The last example of elevated bond yields staying in a tight range for multiple years was under former Fed Chair Alan Greenspan. The US20Y traded between 4.2%-5.3% for four years, culminating in the 2008 financial crisis. Yields tanked and bond prices surged as investors fled to the safety of government-backed interest payments.
Here is a chart that shows the overlay between the S&P 500 and $TLT, circa 2008. Note that volatility in the stock market began increasing long before TLT -0.02%↓(seen in blue) made any meaningful move. Well, TLT -0.02%↓ has been trading in the same 15% range for over two years.
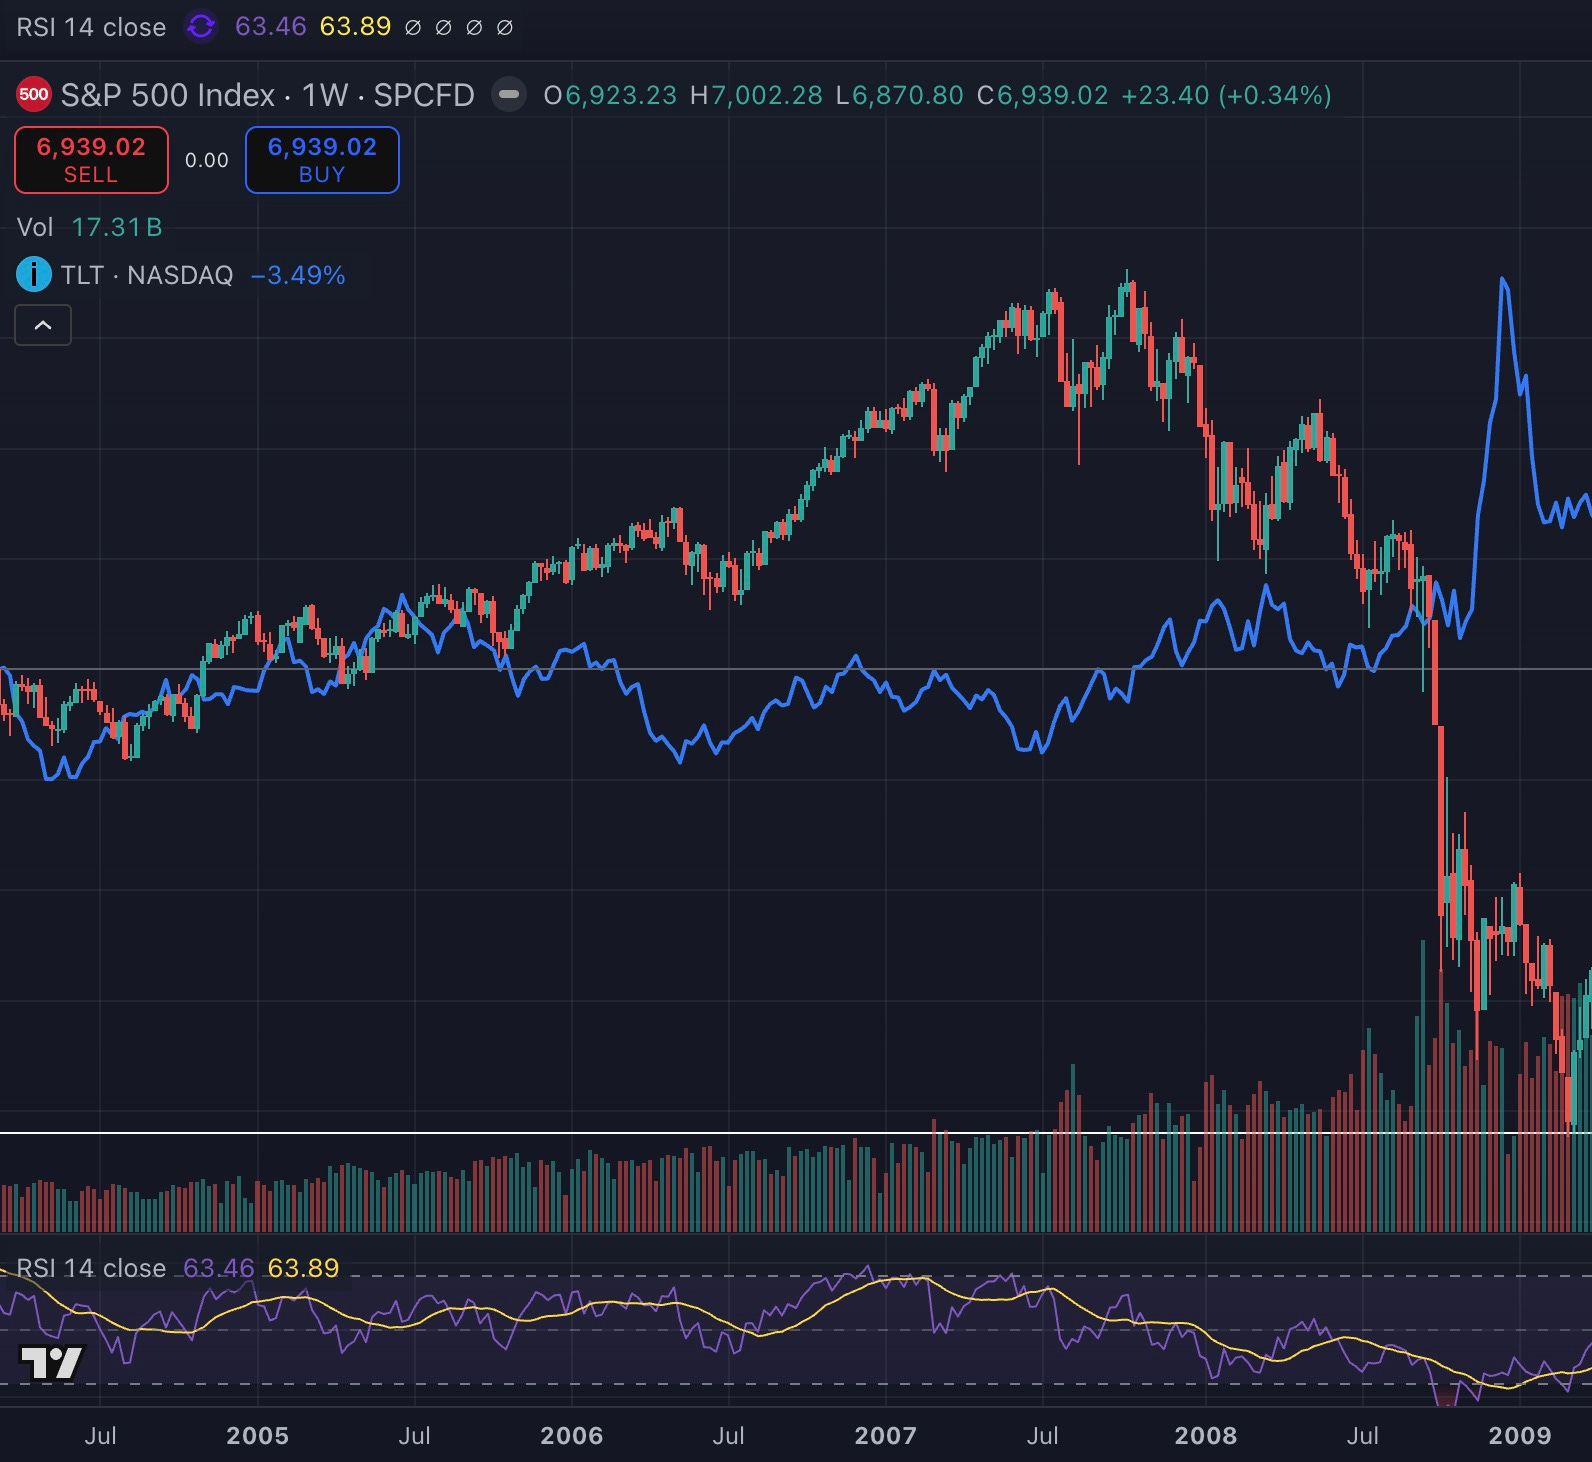
Retrieved from https://www.tradingview.com/chart/PAIfo4NN/?symbol=AMEX%3ASPY on 01/31/2026.
Historical Precedence
The most important thing to note is that bonds stabilize/rally before the Fed pivots. Historically, late-cycle environments look similar: inflation cools, liquidity tightens, and risk assets reprice lower before economic data confirms a slowdown. Bonds tend to stabilize or rally during this phase, not because conditions are improving today, but because markets begin pricing what comes next. This pattern appeared in 2000, 2007, and 2018, and it’s re-emerging now.
The consistent pattern
1. Fed tightens
2. Long-term yields peak
3. Growth slows / unemployment rises
4. Equities fall
5. Bonds rally before the Fed cuts
Where We’re at Now
· Real rates restrictive
· Yield curve inversion
· Lending standards tightening
· Liquidity withdrawal via QT
· Early labor-market softening (Sahm Recession indicator almost triggered)
If precedence holds true, then we are now in the stage where liquidity keeps tightening, inflation keeps falling, growth stocks show weakness from valuation estimates, and bonds start becoming the trade. We try to refrain from “timing the market” and pretending like we know when recessions happen. However, the patterns emerging recently are extremely similar to past crashes. When we see volatility increase in the markets while bond yields stay coiled, it is a textbook signal of a late-cycle “pre-crash” which is a warning we can’t ignore. We remain convicted in our portfolio setup, which consists of bond ETFs being our core positions, couple with minor exposure to stocks in the S&P 500, crypto, and various long-term growth plays. If we’re right, then we will start to see bond ETFs show an increase in both volume and capital gains in the coming months, hand-in-hand with growth equities showing weakness. We have the January unemployment rate being released on February 6, which will further guide our conviction on this allocation.
In Short
The last week of January trading was a signal not to be taken lightly. We saw liquidity tighten extremely fast, resulting in tech stocks and crypto falling sharply. We also saw bond yields staying relatively flat, signaling that inflation expectations should continue dropping, followed by rates, and an increase in labor market weakness. Bonds are a well-known leading indicator, pricing in predicted moves that most investors aren’t even considering. Most leading indicators are signaling red flags, ignore these at your own peril and be left holding the overvalued tech bag.
Want to know which investments we own? Subscribe to our Gold Members subscription. Try it for FREE for the first 90 days!
Pioneer Financial Gold Membership
Thanks for reading! Until next time, good luck out there and Godspeed.
© 2025 Pioneer Financial, LLC — All rights reserved. This newsletter is for informational and educational purposes only and does not constitute investment advice.