The Fed Slashes Rates and the Labor Market Slashes Jobs
The Pioneer Perspective - Week Ending December 19, 2025
What We’ll Cover:
· The 25 basis point cut by the Federal Reserve.
· Reasons for the rate cut despite sticky inflation.
· Is the job market okay?
· Where are we from a historical perspective?
The Federal Reserve held its routine FOMC meeting last week which culminated in an expected 25 basis point CUT. With the recent cut, the Federal Funds rate is now at 3.50-3.75%. If you’re unaware, the Federal Funds rate is the interest rate that a bank would need to pay to the Federal Reserve to get money. The basic idea is that if the Federal Reserve is charging 3.75% then you as a bank would be more incentivized to get cash from another institution that is charging maybe 3.50%. The rate cut on December 10 marks a 1.75% total rate reduction since September 2024. Many economists and X finance gurus are asking why the Federal Reserve would cut rates AGAIN when inflation remains at around 2.7%, which is 30% above the target inflation rate? In 1992, James Carville uttered a quote that has lasted generations: “It’s the economy, stupid.” We’d like to amend that quote, if you’ll allow us, and answer the rate cut question with this: It’s the labor market, stupid.
We got the latest unemployment rating this week, coming in at a hot 4.6%. Median forecasts came in at 4.5%, a slight up-tick from the previous number of 4.4%. The talk of the last three or four years has been INFLATION INFLATION INFLATION. We saw inflation rise from 1.4% at the end of 2020 to a whopping 9.1% in June 2022. See the chart below to get a visual of just how wildly out of control inflation got.
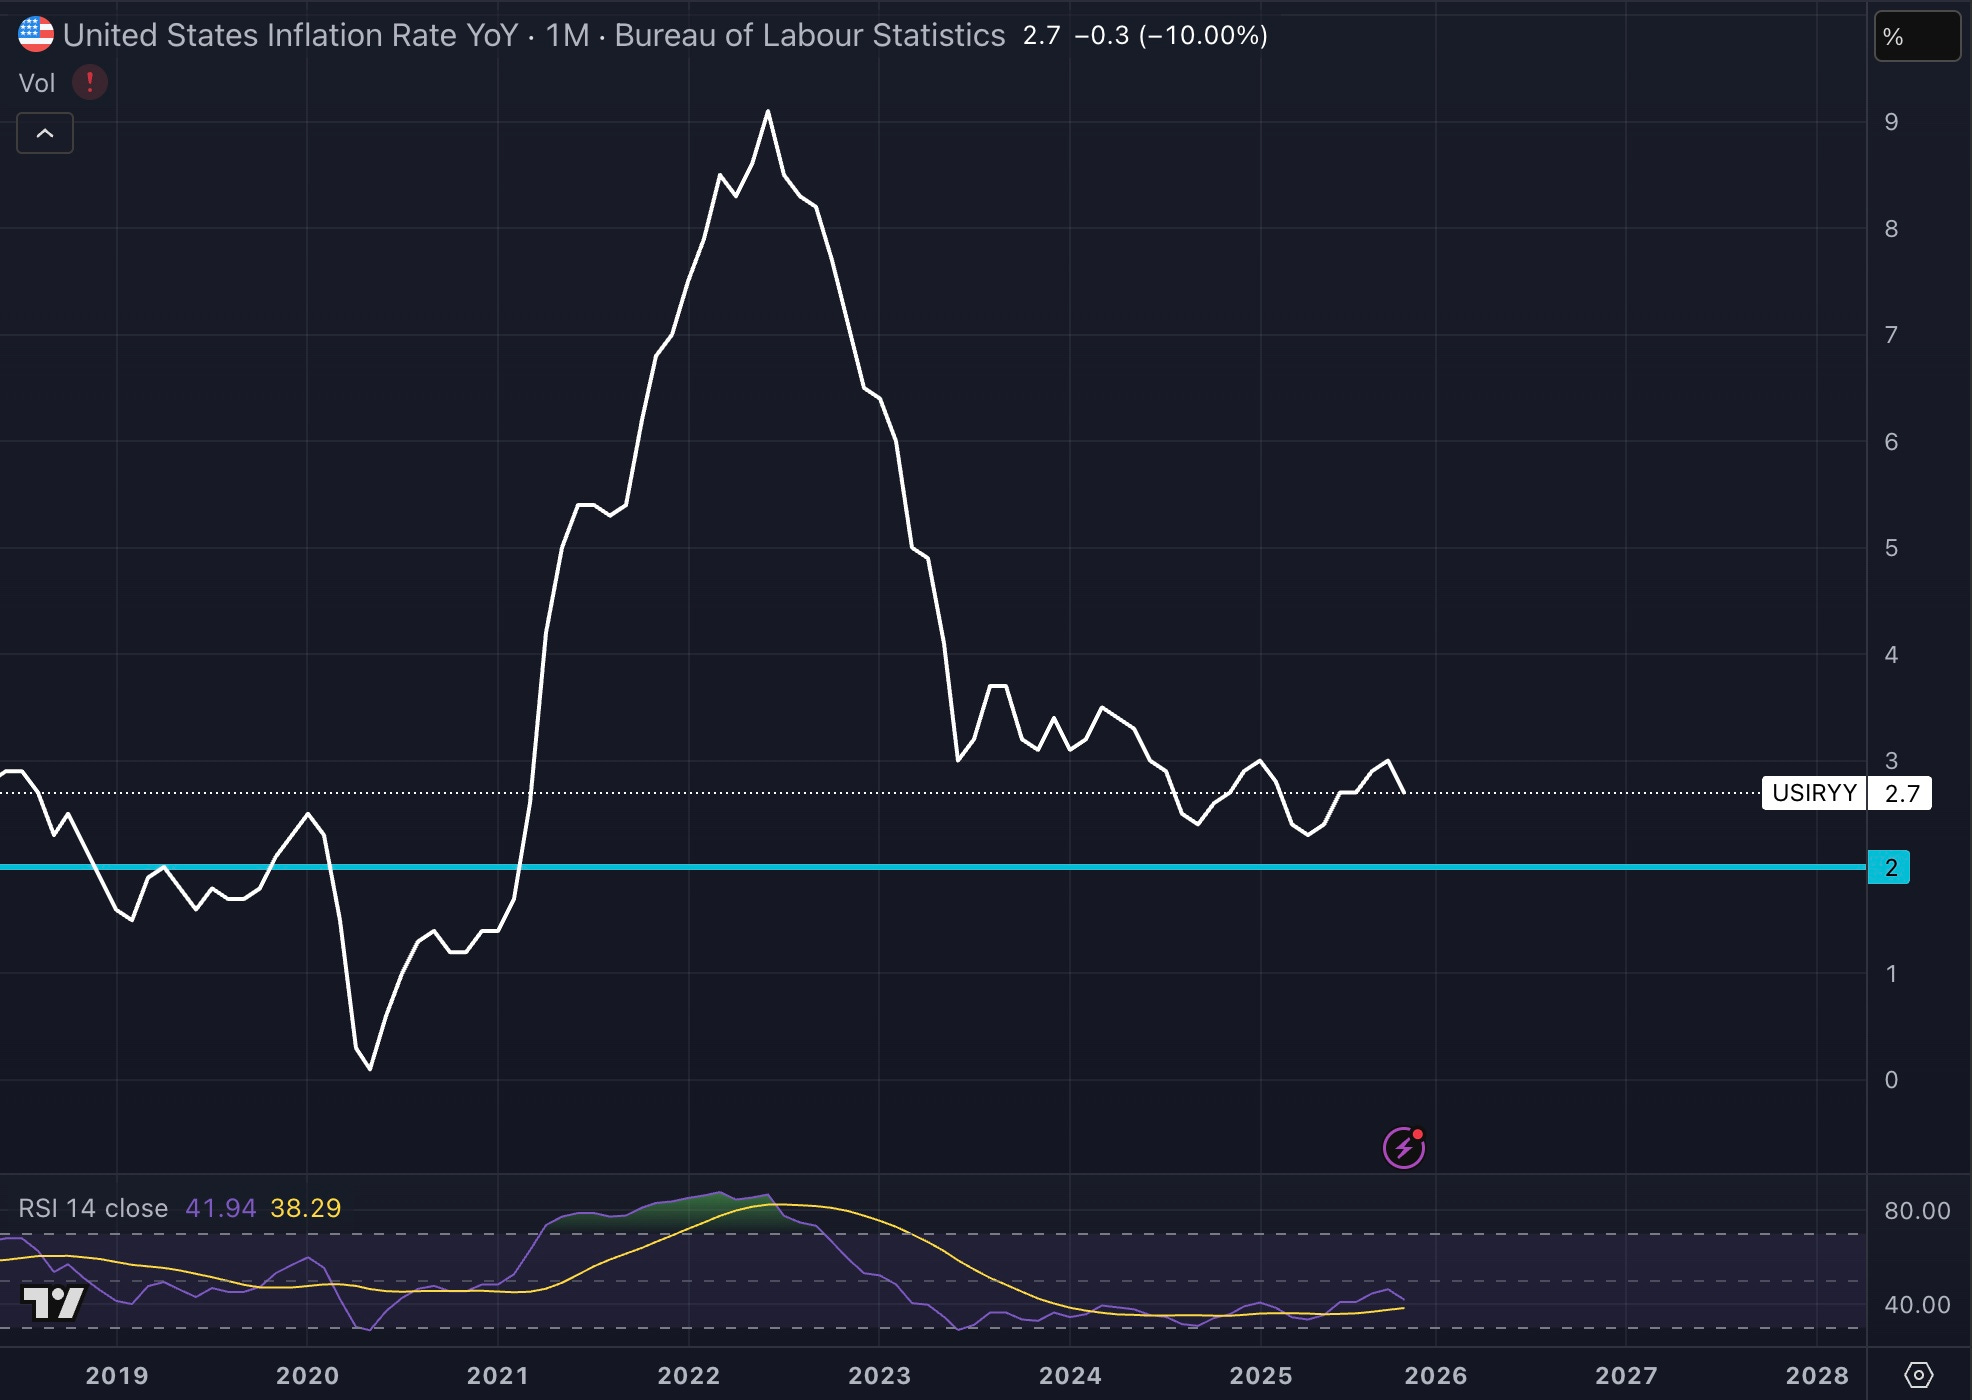
Retrieved from https://www.tradingview.com/chart/PAIfo4NN/?symbol=AMEX%3ASPY on 12/16/2025.
As you can see, despite inflation still being above the target rate of 2%, it has been relatively stagnant for the last 1.5 years. The reason people are still so concerned with affordability and the price of eggs is not because inflation remains at 2.7% but rather because the aggregate increase of goods since the end of 2020 has been 25%. Unfortunately the 25% number is skewed, the aggregate inflation rate for things you buy regularly is much higher. The price of eggs has risen 40%, car insurance is up 56%, beef is up 51%, and butter is up 62%, gas for your home is up 54%, but I digress. The point to take home is that inflation is mostly controlled, the labor market is not. If you don’t believe us, take it from Fed Chair J. Powell himself. He had this to say during the post-FOMC press conference.
“If there are no new tariff announcements, inflation for goods should be peaked by the first quarter of 2026. We should start to see those prices coming down in the back half of next year.” - Jerome Powell, 12/10/2025
We know that Bloomberg might be inclined to tell you that an unemployment rate of 4.6% is historically low, we get it, but as we’ve said before it’s not the total number but the rate of increase that matters.
On November 29, 2025 we said this:
Although we have had a data blackout since the shutdown, we recently got the delayed unemployment rate for September, and it did increase to 4.4%. Again, although historically low, it marks a 23% increase from just two years ago, and the rate of acceleration is increasing as well. As we already mentioned, the data that will come out in December will really be providing two months of unemployment, so we will be paying close attention. We expect unemployment to reach 4.7% by December which would be a 28% increase off the low. Continued rises of unemployment will FORCE liquidity to dry, making discretionary investing impossible.
We expected unemployment to come in at 4.7% so the final number was just below our call. The rate of increase is still not reassuring of a thriving economy. We’ve mentioned the Sahm Rule Recession Indicator before, it is the economic metric that measures the 3-month rolling average of unemployment against the 12-month low of unemployment rates. It’s very simple yet uncanny in accuracy. When the Sahm indicator gets above a 0.5% increase in the last three months it suggests a recession has begun and there is something deeply wrong underneath the headlines of the stock market. We’d like to take you back in time to the recessions of 2001 and 2008 and show you exactly which month the Sahm rule crossed the sinister 0.5% line.
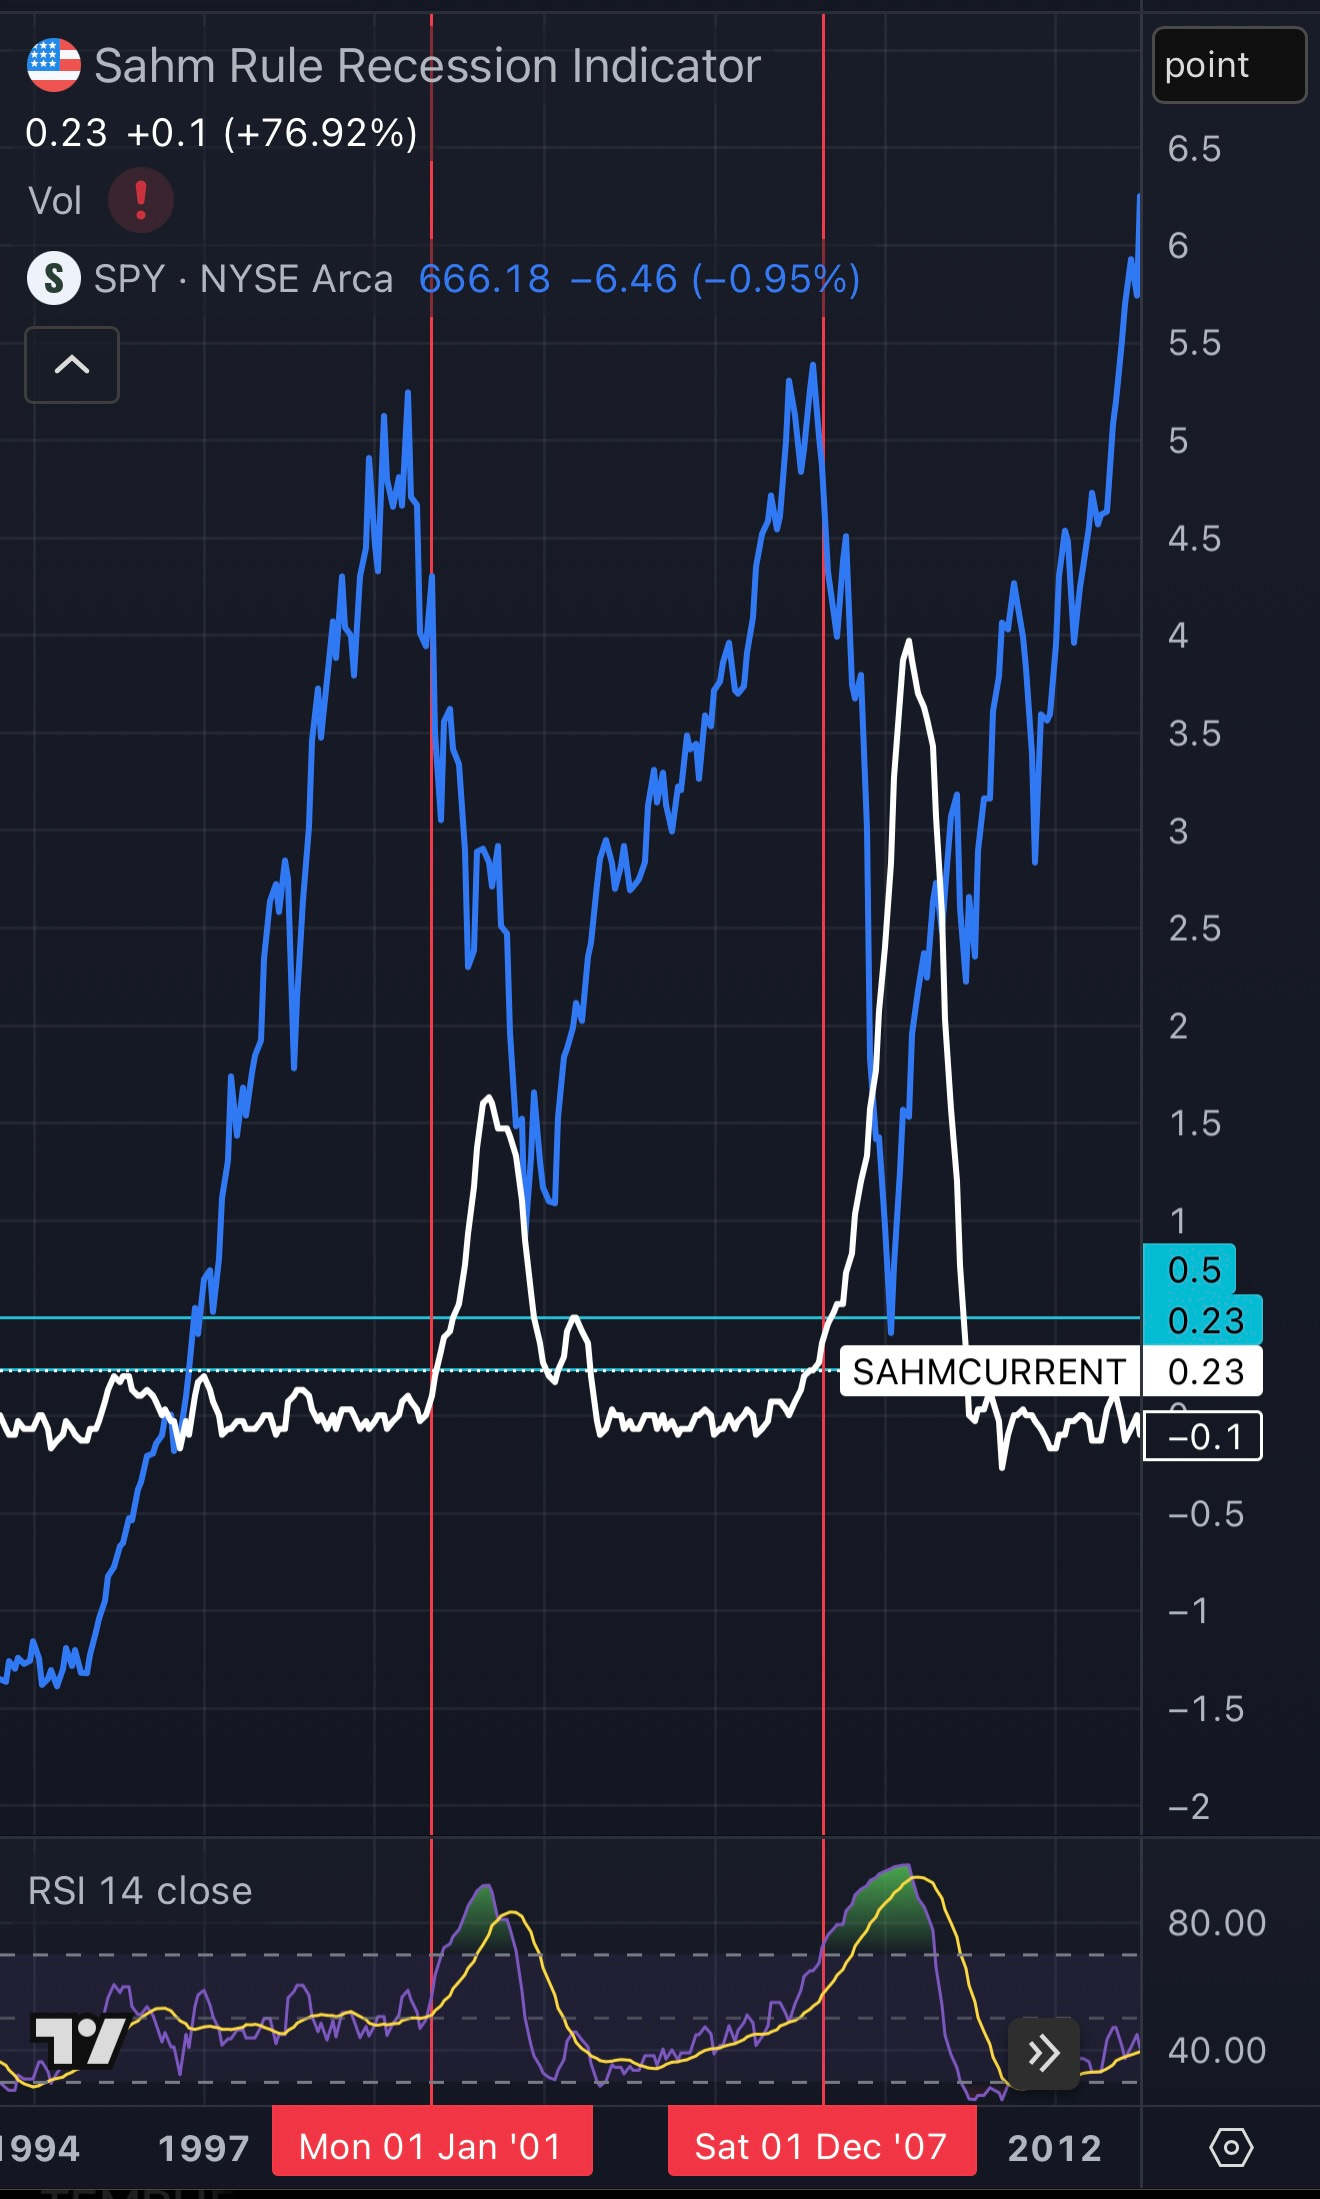
Retrieved from https://www.tradingview.com/chart/PAIfo4NN/?symbol=AMEX%3ASPY on 12/17/2025.
In the chart above the white line is the Sahm rule, the overlapping blue line is the S&P 500. Note that the S&P was already in a slight decline when the Sahm rule was triggered, and it preceded a sharp drop in stocks over the following 12-24 months. Here’s where things get really interesting. The Sahm rule hasn’t been officially updated yet because it takes time to make it into the chart after unemployment rates have been announced. However, we can mathematically figure out where it will end up based on the recent unemployment rate. We take the 3-month rolling average unemployment rate of 4.43% and subtract the previous 12 month low which is 4%. This gives us a number of 0.43%, dangerously close to the 0.5% mark. See the chart below:
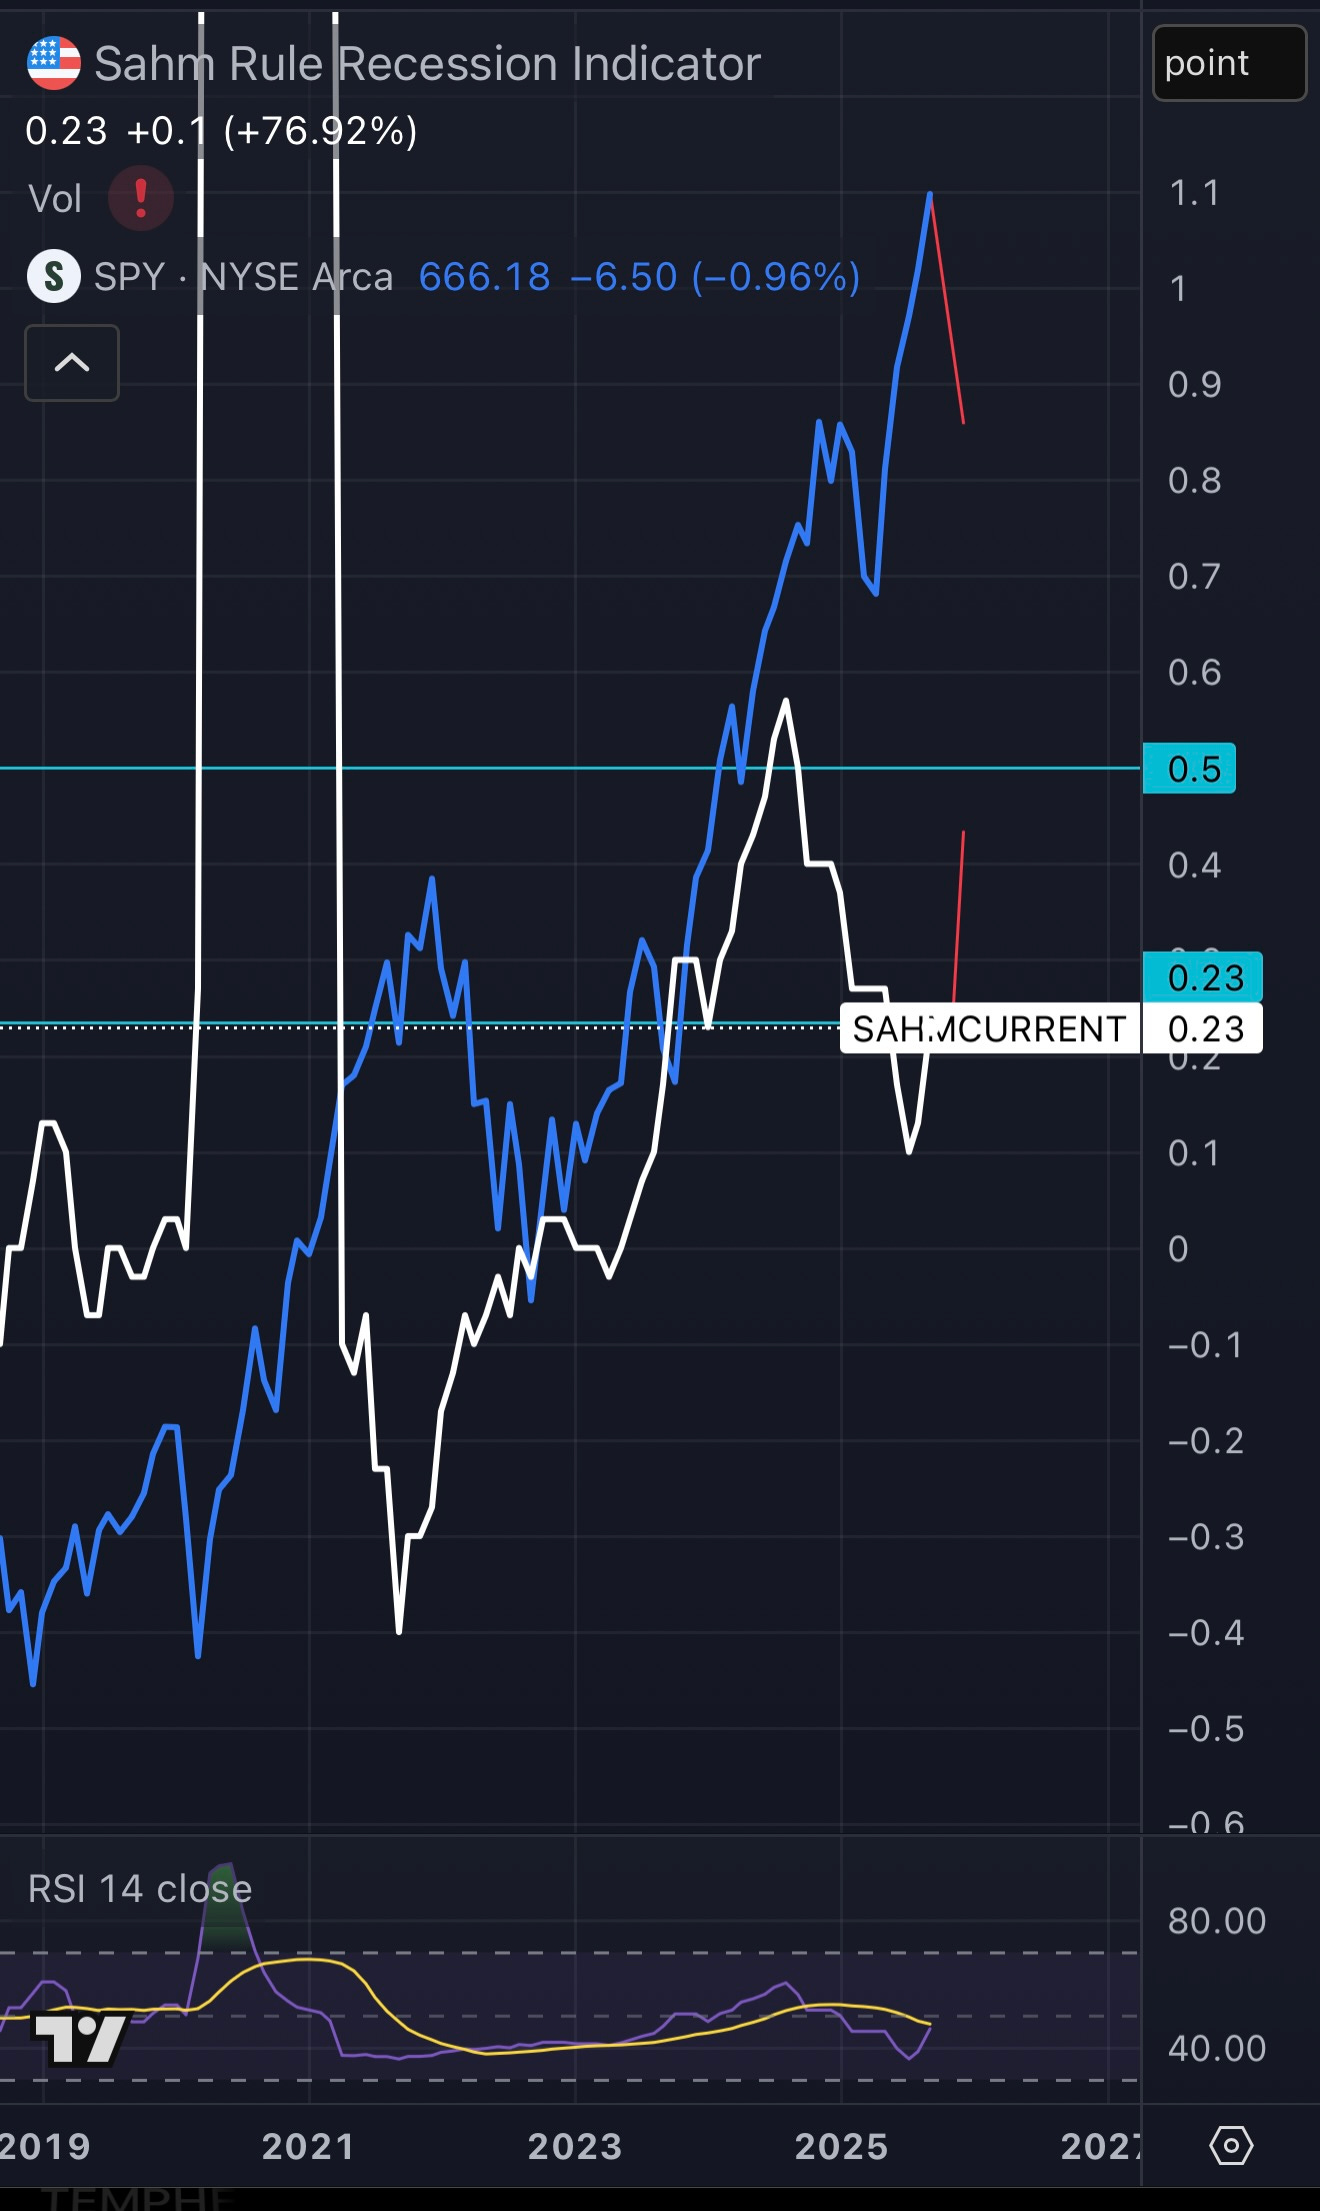
Retrieved from https://www.tradingview.com/chart/PAIfo4NN/?symbol=AMEX%3ASPY on 12/17/2025.
Here is a zoomed in chart of the present-day Sahm rule. The red line attached to the Sahm rule white line is where the rule SHOULD be right now based on BLS data. Since the Sahm rule is on a one month timeline, the S&P blue line is not up-to-date either. The red line you see attached to the end of it is the current price. Notice the S&P has experienced a solid retrace from failing to hold all-time highs (double top pattern). Please glance back up at the historical 2001/2008 chart to see how eerily similar this is.
We will give you one more piece of fascinating economic insight on this phenomenon. With the current unemployment rate, the Sahm rule will be triggered next month even if the unemployment rate STAYS FLAT OR DECREASES. In order for the rule to trigger, the rolling 3-month average needs to hit 4.50%, just 0.07% away. Now, with October unemployment coming in at 4.4%, and Novembers at 4.6%, a December rate of 4.4% will make the 3-month average 0.5%! In summary, an unemployment rate of 4.4% for December is all that’s needed to trigger the indicator. All the Sahm rule really observes is unemployment momentum. Unfortunately, that momentum appears to be accelerating faster than anticipated by expert economic analysts.
How are we allocating assets? Subscribe to our Gold Member ship to get full updates on our portfolio! Link below:
https://pioneerfinancialllc.com/products/gold-membership
Until next time, good luck and Godspeed.
© 2025 Pioneer Financial, LLC — All rights reserved. This newsletter is for informational and educational purposes only and does not constitute investment advice.